Monthly Archives: March 2016

Stocks are Heading Higher

Stocks are Heading Higher

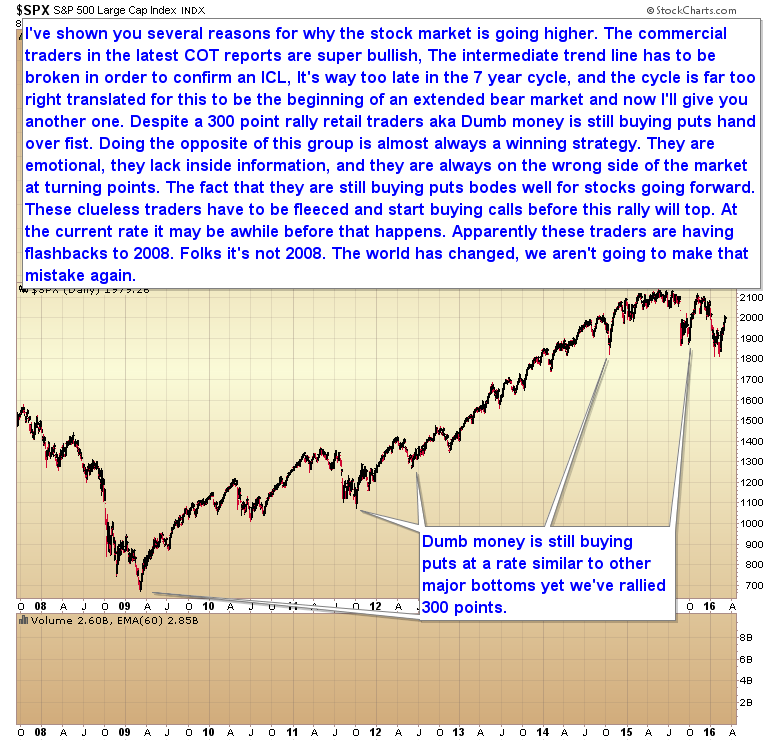
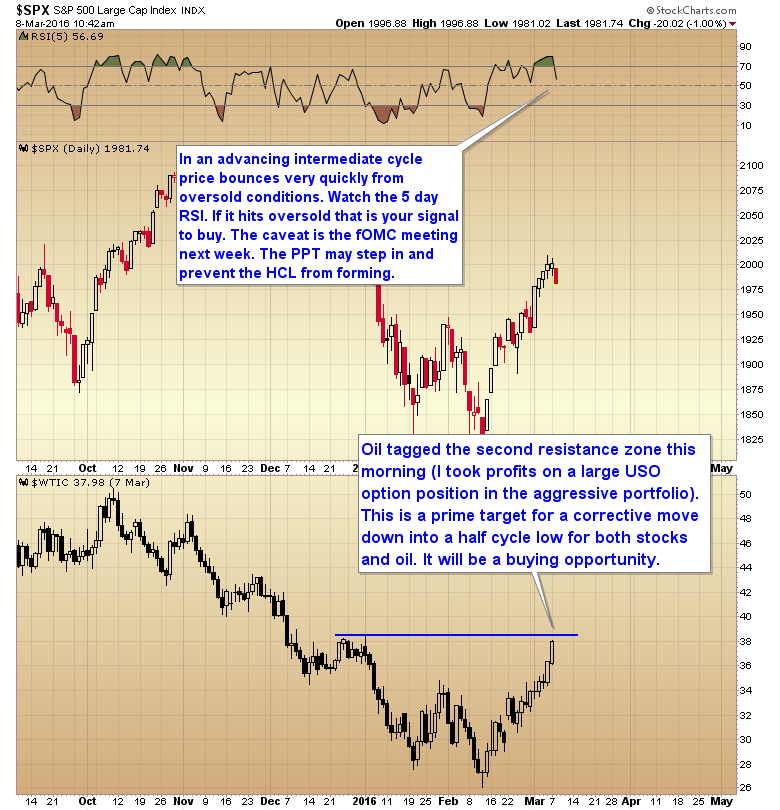
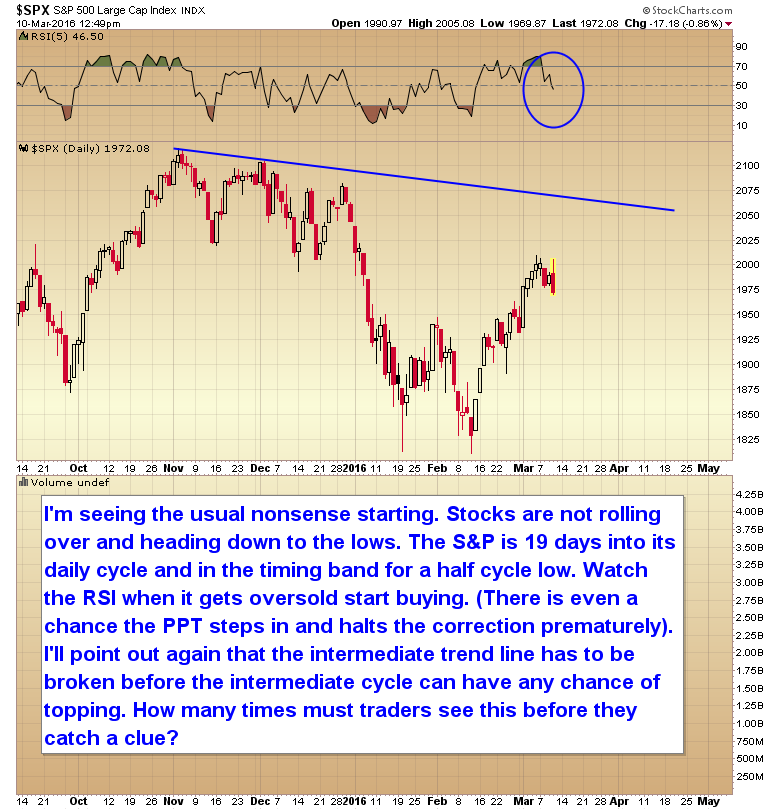
Stocks are heading higher. And I’m seeing the usual nonsense starting. Stocks are not rolling over and heading down to the lows. The S&P is 19 days into its daily cycle and in the timing band for a half cycle low. Watch the RSI when it gets oversold, start buying. (There is even a chance the PPT steps in and halts the correction prematurely).

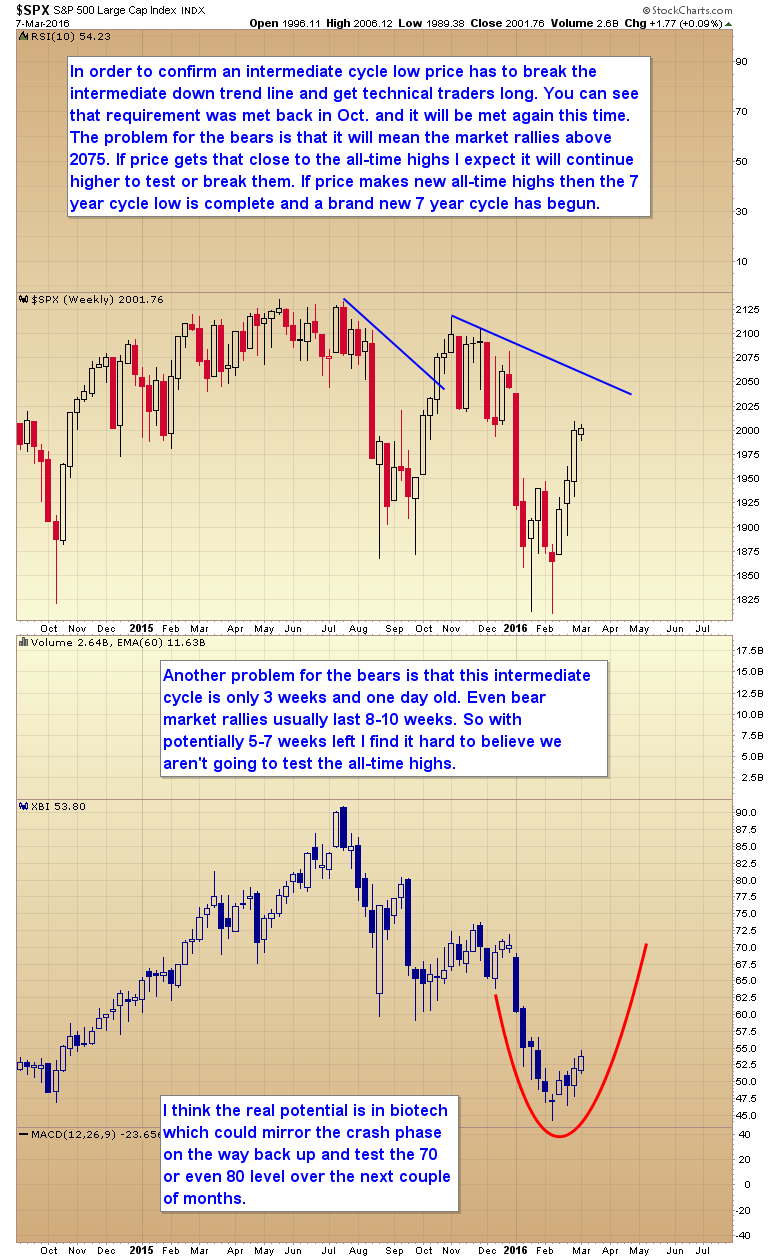
I’ll point out again that the intermediate trend line has to be broken before the intermediate cycle can have any chance of topping. How many times must traders see this before they catch a clue?

Like our new Facebook page to stay current on all things Smart Money Tracker


Short Term Gold Direction – CHART OF THE DAY

Short Term Gold Direction

I’m watching the triangle trend line today as the ECB meeting has the potential to decide direction in the currency markets. This, in turn, will likely influence the short term gold direction. If it takes the euro down and the dollar up, then gold will likely break that trend line and I will sell the remaining 25% position and get on the sidelines until the next Intermediate Cycle Low in May or June.

After rallying 85% now is not the time to buy mining stocks for a short term trade.

Like our new Facebook page to stay current on all things Smart Money Tracker

Reasons Why the Stock Market is Going Higher

Going Higher

I’ll shown you several reasons for why the stock market is going higher. The commercial traders in the latest COT reports are super bullish. The intermediate trend line has to be broken in order to confirm an intermediate cycle low. It’s way too late in the 7-year cycle, and the cycle is far too right translated for this to be the beginning of an extended bear market.

And now I’ll give you another one. Despite a 300 point rally retail traders, aka Dumb Money, are still buying puts hand over fist. Doing the opposite of this group is almost always a winning strategy. They are emotional, they lack inside information, and they are always on the wrong side of the market at turning points.

The fact that they are still buying puts bodes well for stocks going forward. These clueless traders have to be fleeced and start buying calls before this rally will top. At the current rate it may be awhile before that happens.

Apparently these traders are having flashbacks to 2008. Folks, it’s not 2008. The world has changed. We aren’t going to make that mistake again.

Like our new Facebook page to stay current on all things Smart Money Tracker

Temporary Peak in Stocks and Oil

temporary peak

The stock market appears to have made a temporary peak. In its advancing intermediate cycle price bounces very quickly from oversold conditions. Watch the 5 day RSI. If it hits oversold that is your signal to buy. The caveat is the FOMC meeting next week. The PPT may step in and prevent the half cycle low from forming.

The oil market also appears to have made a temporary peak. Oil tagged the second resistance zone this morning (I took profits on a large USO option position in the aggressive portfolio). This is a prime target for a corrective move down into a half cycle low for both stocks and oil. It will be a buying opportunity.

Like our new Facebook page to stay current on all things Smart Money Tracker

The Real Potential is in Biotech

biotech with potential

In order to confirm an intermediate cycle low, price has to break the intermediate down trend line and get technical traders long. You can see that requirement was met back in October and will be met again this time.

The problem for the bears is that it will mean the market rallies above 2075. If price gets that close to the all-time highs I expect it will continue higher to test or break them.

If price makes new all-time highs then the 7-year cycle low is complete and a brand new 7-year cycle has begun.

Another problem for the bears is that this intermediate cycle is only 3 weeks and one day old. Even bear market rallies usually last 8-10 weeks. So with potentially 5-7 weeks left I find it hard to believe we aren’t goiung to test the all-time highs.

I think the real potential is in biotech which could mirror the crash phase on the way back up and test the 70 or even 80 level over the next couple of months.

Like our new Facebook page to stay current on all things Smart Money Tracker

Commodities Have Bottomed – $CRB

Commodities have Bottomed

For months and months I’ve been saying that the CRB would form its final 3 year cycle low along with the 7-year cycle low in the stock market. This has been the pattern for the last decade and a half.

Considering the CRB is now deep in the timing band for a major cycle bottom, the odds are good that the low last month was the final 3 YCL. That is, commodities have bottomed.

If that’s the case then stocks have to have also formed their 7 YCL. I would have liked to see the S&P test 1600 but it’s not looking good at this point.

Like our new Facebook page to stay current on all things Smart Money Tracker