Like our new Facebook page to stay current on all things Smart Money Tracker
Monthly Archives: December 2016
Metal portfolio update
The reversal this morning in metals despite the weaker dollar was enough of a red flag for us to take profits on our metal positions and wait to see what the new year brings.
The leveraged metal portfolio is up 83%
The unleveraged metal portfolio is up 61%
Like our new Facebook page to stay current on all things Smart Money Tracker
metal portfolio
The leveraged metal portfolio is already back over +100%.
Before this intermediate rally is over I expect the leveraged portfolio will be up somewhere between 400-1000%.
How stupid are all the naysayers starting to look now?
In bull markets all timing mistakes get corrected.
Yes we got sidetracked by the middle of the night reversal on election night. The powers that be acted to prevent the stock market from opening limit down and it infected the gold market, causing the intermediate cycle to stretch an extra 10 weeks, but it hasn’t stopped the bull market, and it isn’t going to stop us from making money.
Like our new Facebook page to stay current on all things Smart Money Tracker
CHART OF THE DAY
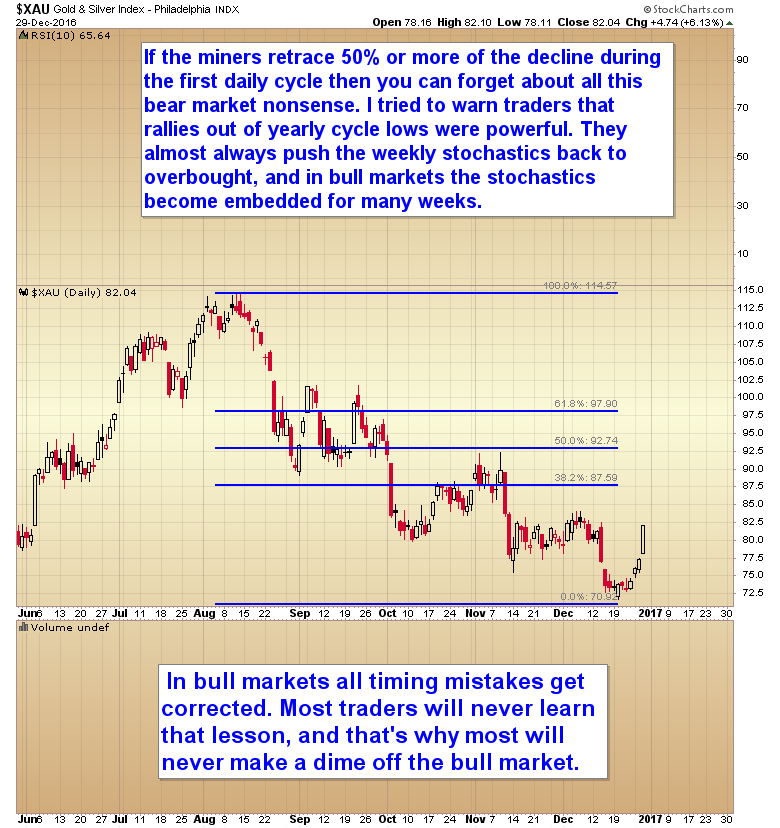
GOLD YEARLY CYCLE LOW
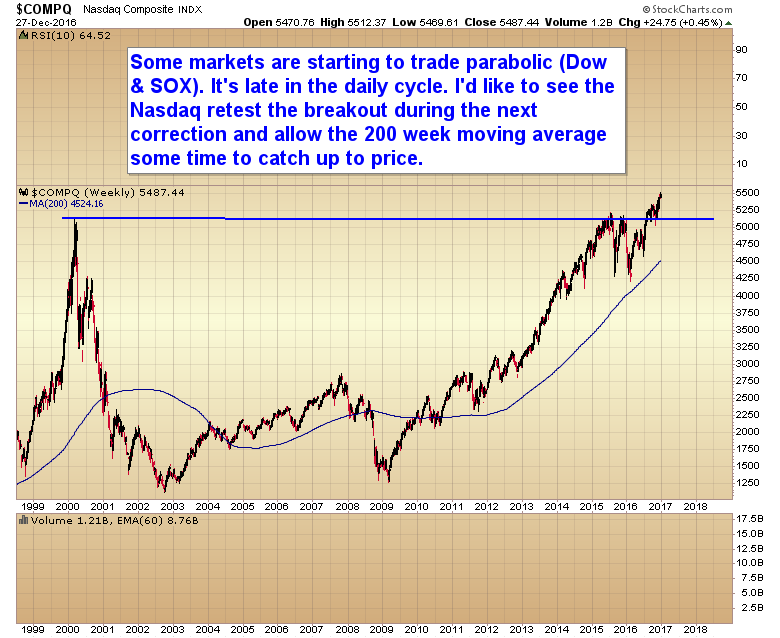
CHART OF THE DAY – NASDAQ
Metal portfolio
Despite what many of the trolls would like everyone to believe the metal portfolio is still up 50%. I don’t know anyone who would be unhappy with a 50% gain. Sure it’s not as good as +127% but still +50% isn’t anything to sneeze at.
We got stopped out when gold lost $1275 right after the election. Now I’m trying to get in at the bottom of this yearly cycle low. We’ve made a couple of tries, but gotten stopped out at basically break even twice now as this daily cycle is stretching longer than normal.
I’m waiting for the next potential setup to try again. It may come this week. Sentiment is extreme.
Like our new Facebook page to stay current on all things Smart Money Tracker
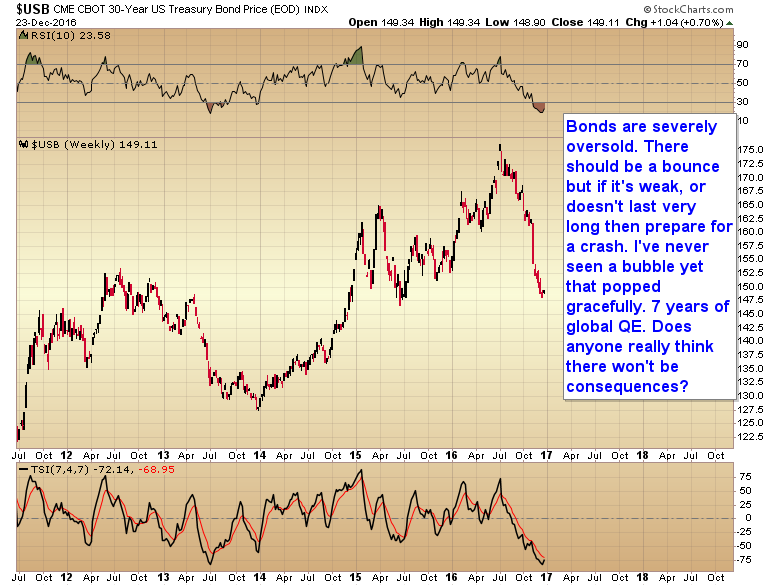
CHART OF THE DAY – MOMENT OF TRUTH FOR BONDS
Moment of Truth for Bonds
Bonds are severely oversold. There should be a bounce but if it’s weak, or doesn’t last very long then prepare for a crash. I’ve never seen a bubble yet that popped gracefully.
Like our new Facebook page to stay current on all things Smart Money Tracker
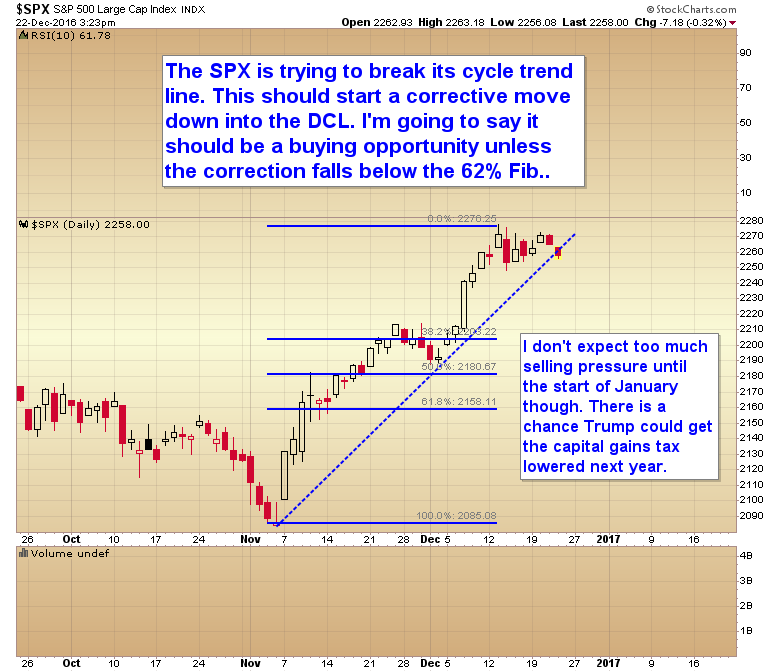
CHART OF THE DAY – S&P 500
S&P 500
The S&P 500 is trying to break its cycle trend line. This should start a corrective move down into the daily cycle low.
Like our new Facebook page to stay current on all things Smart Money Tracker
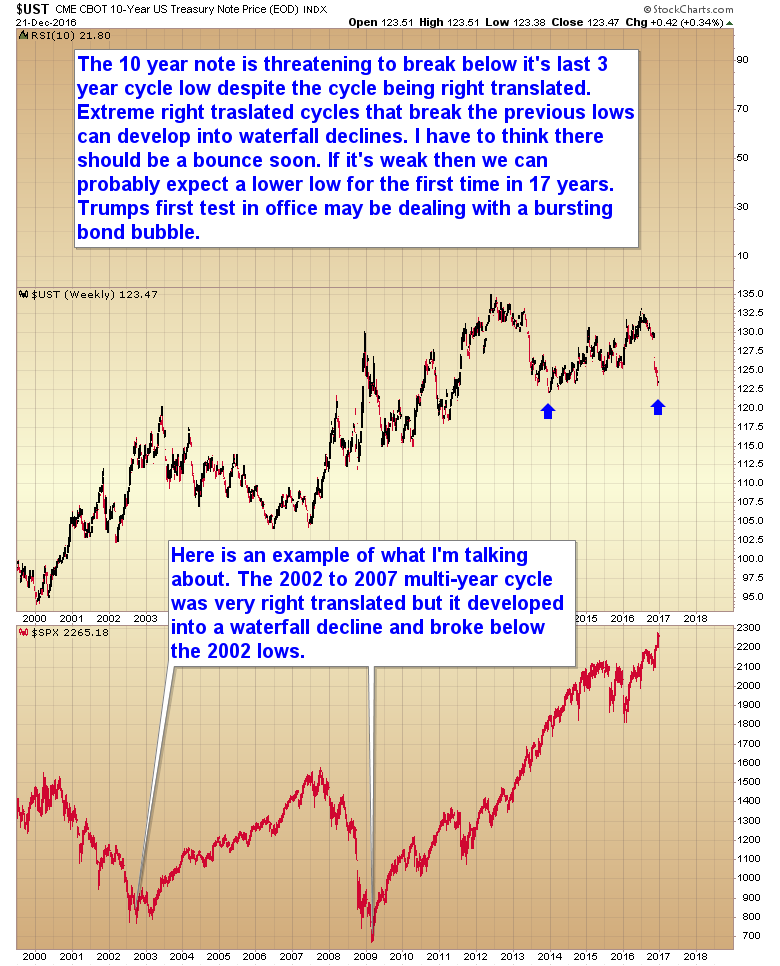
CHART OF THE DAY – 10 Year Note
10 Year Note
The 10 Year Note is threatening to break below its last 3 year cycle low despite the cycle being right translated. Trump’s first test in office may be dealing with a bursting bond bubble.
Like our new Facebook page to stay current on all things Smart Money Tracker